week 2 notes for HWDSC
Contents
Notes for week 2.
1. Exploratory data analysis
1.1 Visualizations
EDA is an ART!
1.11 Explore individual features
- Histograms
- Plots (index vs value)
- Statistics
1.12 Explore feature relations
Pairs
- Scatter plot/scatter matrix
- Corrplot
Groups
- Corrplot + clustering
- Plot (index vs feature statistics)
# individual features

## histogram
plt.hist(x)

## plot
plt.plot(x,'.') # 观察横线竖线可以得出结论:是否shuffle,是否有很多相同的值
plt.scatter(range(len(x)), x, c=y) #按标签上颜色

## statistics
df.describe()
x.mean()
x.var()

## other tools
x.value_counts()
x.isnull()

# feature relations

plt.scatter(x1, x2)
pd.scatter_matrix(df)
df.corr(), plt.matshow( ... )
df.mean().sort_values().plot(style=’.’) # sort下找有没有group
1.2 Data Cleaning and Other Things
1.21 dataset cleaning
- Constant features
traintest.nunique(axis=1) == 1
train.nunique(axis=1) == 1
- Duplicated features
尽量搞明白为什么会duplicate。
traintest.T.drop_duplicates()

# 名字不一样,但是一一对应的duplicate特征:
for f in categorical_feats:
  traintest[f] =raintest[f].factorize()

traintest.T.drop_duplicates()
1.22 Other things
- Duplicated rows
Check if same rows have same label
Find duplicated rows, understand why they are duplicated
- Shuffled or not
画图,target mean value和rolling mean value。看是不是上下摆动。如果有异常则要深入研究。
1.23 Tools
- Graph visualization with NetworkX
- ggplot
- bokeh
- plotly
- seaborn
- Biclustering algorithms for sorting corrplots
2. EDA examples
观察缺失值的情况,思考原因。
观察数据里的patern,比如这里出现了多个feature对一个object有相同值的pattern。这种pattern应该要去做feature engineering。而这种patern XGboost是很难发现的。比如:
- 重新建一个feature计算有多少feature相同值。
- 建一个feature,如果那些feature的值都相同为1,反之为0
观察到特征可能是累计的,所以做新feature作差。
- 线性模型比如神经网络可以自己捕捉到,但是树类不行。
观察到特征可能是时间的,比如有很多6的倍数,所以做新feature: modular 12/ modular 6
df.dtypes
df.info
x.value_counts()
x.isnull()
3. Validation
3.1 Validation and Overfitting
- Validation helps us evaluate a quality of the model
- Validation helps us select the model which will perform best on the unseen data
- Underfitting refers to not capturing enough patterns in the data
- Generally, overfitting refers to
- capturing noize
- capturing patterns which do not generalize to test data
- In competitions, overfitting refers to
- low model’s quality on test data, which was unexpected due to validation scores
3.2 Validation strategies
- Holdout
- K-fold
- Leave-one-out* (不常用,一般数据量太少才用)
3.21 Holdout
ngroups = 1
sklearn.model_selection.ShuffleSplit
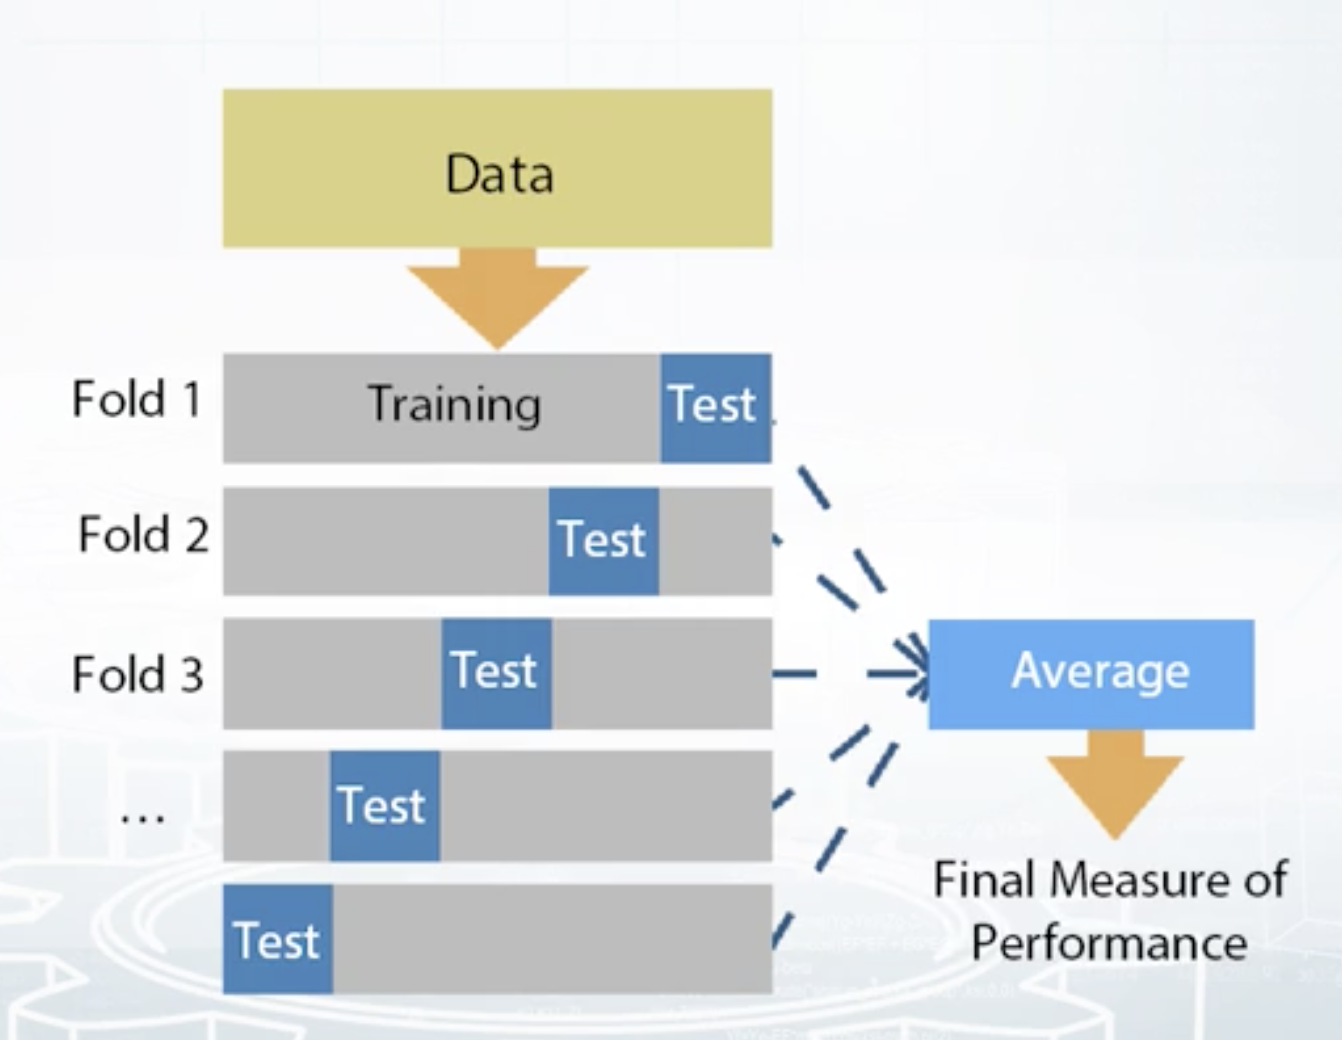
3.22 K-fold
- Split train data into K folds.
- Iterate though each fold: retrain the model on all folds except current fold, predict for the current fold.
- Use the predictions to calculate quality on each fold. Find such hyper-parameters, that quality on each fold is maximized. You can also estimate mean and variance of the loss. This is very helpful in order to understand significance of improvement.
ngroups = K
sklearn.model_selection.Kfold
3.23 Leave-one-out
ngroups = len(train)
sklearn.model_selection.LeaveOneOut
3.24 Stratification
Stratification preserve the same target distribution over different folds.
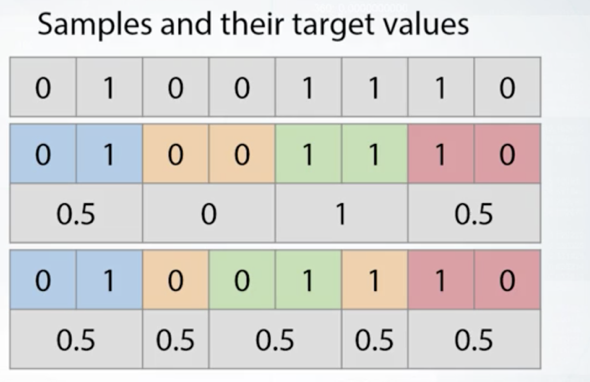
上图可以看出,上面的分组是不合适的,而下面调整使得每组都平均0.5,更加合适。
- Stratification is useful for:
- Small datasets
- Unbalanced datasets
- Multiclass classification
3.3 Data Spliting Strategies
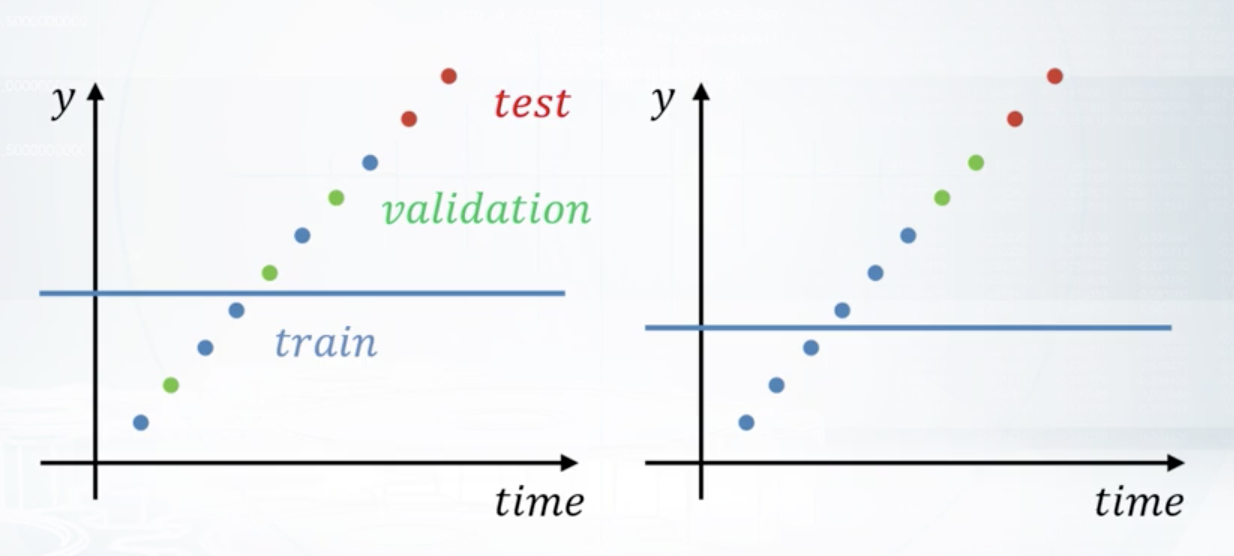
Different splitting strategies can differ significantly
- in generated features
- in a way the model will rely on that features
- in some kind of target leak
Methods:
- Random, rowwise
- Timewise
- Byid
- Combined*
Conclusion:
- Always mimic the train/test split made by organizers